In the vast world of financial markets, identifying potential trend reversals can be the difference between success and failure for traders and investors. One of the most compelling indicators of such shifts is the Morning Star pattern—a powerful candlestick formation that often signals a bullish reversal following a downtrend. Understanding this pattern and its implications through technical analysis can equip market participants with the insights needed to make informed decisions.
Understanding the Morning Star Pattern
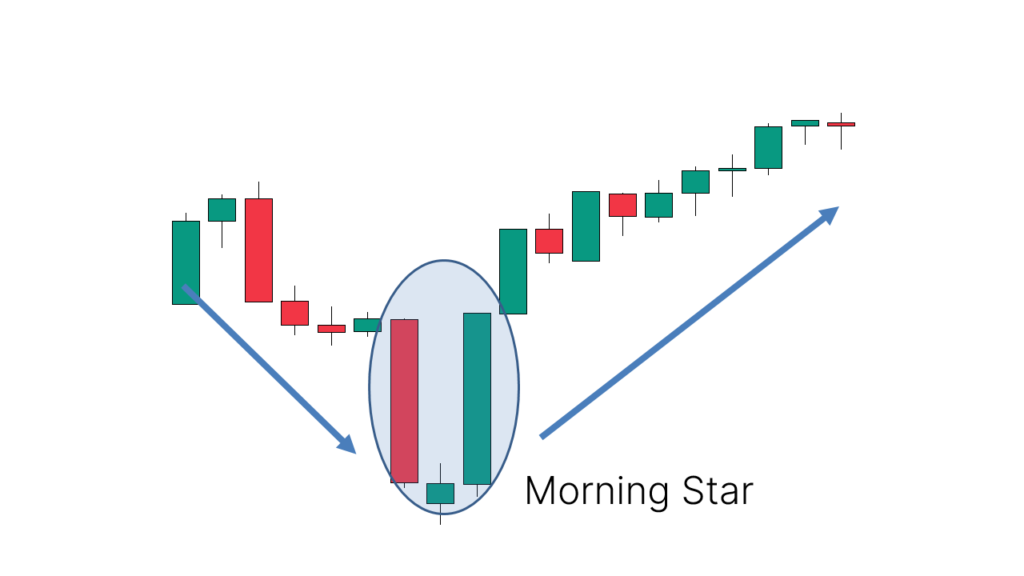
The Morning Star pattern is a three-candlestick formation that traditionally indicates a potential upward trend reversal in the market. Characterized by its distinct structure, it includes:
- A Long Bearish Candle: Typically, this candle reflects the continuation of the existing downtrend, indicating strong selling pressure.
- A Smaller Candle with a Gap: Often referred to as the ‘star,’ this candle can be bullish, bearish, or neutral. It represents indecision in the market, where the previous selling may be losing steam. Importantly, it usually forms with a gap, appearing below the first candle, though this gap may not be as noticeable in markets that trade continuously.
- A Long Bullish Candle: This candle signifies the recovery, as buyers enter the market with conviction, pushing prices higher. It validates the reversal potential suggested by the star.
The Morning Star pattern reflects a shift in market sentiment, where selling pressure transitions to buying pressure, highlighting the possibility of an upward movement. Recognizing this pattern early through technical analysis can help traders position themselves advantageously as the market starts to shift.
Technical Analysis: The Backbone of Pattern Recognition
Technical analysis is essential for identifying patterns like the Morning Star. By examining past price movements, volumes, and other market data, traders can forecast potential future directions. The Morning Star pattern’s significance is magnified when integrated into a broader technical analysis strategy.
Key Elements of Technical Analysis
– Price Trends: Monitoring trends allows traders to identify when a market is in decline or poised for growth. The Morning Star appears during a bearish trend, signaling a potential reversal.
– Support and Resistance Levels: These levels indicate where prices tend to pause and reverse. When a Morning Star pattern forms near a significant support level, its reliability as a reversal signal is heightened.
– Volume Analysis: Changes in trading volume can confirm price movements. A Morning Star pattern accompanied by increased volume on the bullish candle lends credibility to the reversal signal.
– Other Indicator Convergence: Integrating the Morning Star with other technical indicators such as Moving Averages, Bollinger Bands, or the Relative Strength Index (RSI) can reinforce its validity. If the Morning Star aligns with signals from these indicators, it may strengthen the forecasted trend reversal.
Using Morning Star Pattern as Part of a Trading Strategy
To effectively incorporate the Morning Star pattern into a trading strategy, one must be mindful of the following considerations:
Entry and Exit Points
Once a Morning Star pattern is identified, traders should look for confirmation in subsequent candles before entering a trade. An entry signal is often validated once the price closes above the high of the bullish candlestick. Additionally, setting exit points based on other pattern formations or converging technical indicators can optimize trade performance.
Risk Management
Every trading strategy needs robust risk management protocols. With the Morning Star pattern, placing stop-loss orders below the formation or beneath recent support levels can safeguard against unforeseen downturns. This ensures that while aiming for profits, traders are not exposed to significant losses.
Broader Market and Economic Context
While the Morning Star pattern is a robust technical signal, factors such as broader market conditions and economic indicators should also be considered. News events, earnings reports, and macroeconomic data can play a crucial role in altering market directions, sometimes overshadowing technical signals.
Real-World Application: Case Studies
Consider the application of the Morning Star pattern in various market contexts. In stock trading, imagine a share in decline due to industry-wide concerns. As the fundamentals stabilize and sentiment shifts, a Morning Star pattern appears. By using technical analysis, alongside understanding the industry dynamics, traders can capitalize on the anticipated recovery.
Similarly, in the forex market where liquidity and volatility are abundant, identifying a Morning Star can provide essential cues amidst chart noise. Traders often leverage such patterns during high-impact economic releases that cause sharp market movements.
Conclusion
The Morning Star pattern is a formidable ally in signaling potential market trend shifts. Recognizing and interpreting this pattern through diligent technical analysis empowers market participants to navigate complexities inherent in financial markets. By integrating the Morning Star into broader trading strategies, backed by sound risk management and an awareness of external factors, traders and investors can enhance their decision-making processes significantly.
In the dynamic and ever-evolving landscape of financial markets, remaining vigilant and proactive is paramount. As trends fluctuate and market sentiment ebbs and flows, the Morning Star pattern serves as a beacon for those seeking to uncover opportunities amid uncertainty. Whether you’re an experienced trader or a novice investor, the tools provided by technical analysis—and particularly the insights gleaned from patterns like the Morning Star—are indispensable for achieving success in your financial endeavors.